
Technical tutorial · GUEMISA
Predictive maintenance program
Vibration analysis, thermography, and lubricant analysis are predictive maintenance techniques that allow you to find the causes of potential failures, anticipating breakdowns. The program follows a logical three-step sequence:
| Passed | Function |
|---|---|
| Detection | Problem recognition |
| Analysis | Locating the cause of the problem |
| Correction | Finding the right time and way to solve the problem |
Detection requires constant monitoring of vibration levels. The interval between measurements depends on each piece of equipment and varies from two months to continuous measurement, depending on the type of machine and its importance in the process. Measurement points are located where bearings, fans, gears, or shaft connections are housed. A data collector with software is used to store the values; the historical data is used to detect a problem when the trend increases or changes significantly.
The nine steps of organizing the program
- Plant identification.
- Machine selection.
- Choosing optimal techniques for verification.
- Implementation of predictive technology.
- Setting and reviewing data and acceptable condition limits.
- Reference measurements.
- Collection, recording and analysis of trends.
- Machine condition analysis.
- Bug fixes.
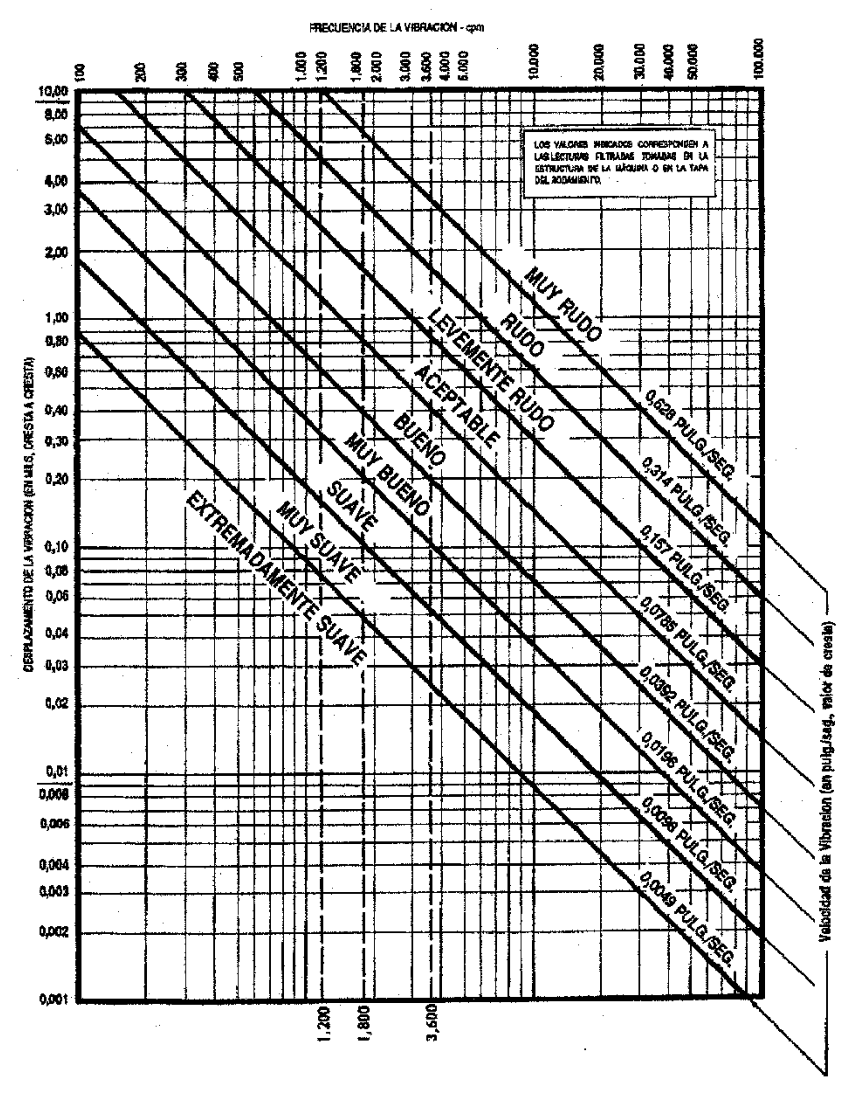
Acceptable condition limits are established using historical data obtained from repeated measurements: the average value gives the acceptable vibration level for each point. Initially, without historical data, the manufacturer's instructions and severity charts are used.
Vibration magnitudes
Vibration is the back-and-forth movement of a machine or one of its components, in any direction in space, from its equilibrium position. Its common causes include imbalance of rotating elements, misalignment in couplings, worn or damaged gears, deteriorated bearings, aerodynamic or hydraulic forces, and electrical problems.
| Magnitude | What does it indicate? | Unit |
|---|---|---|
| Frequency | Number of complete cycles in a period of time; its correspondence with rpm identifies the problem and the responsible part | cpm (cycles per minute) |
| Displacement | Vibration amplitude; measured at low frequencies | – |
| Speed | The highest peak of the entire range of motion of the element when vibrating; it is a direct indicator of the severity and the parameter that is always measured | mm/s |
| Acceleration | Related to the force that causes the vibration; relevant at high frequencies even if speed and displacement are small | – |
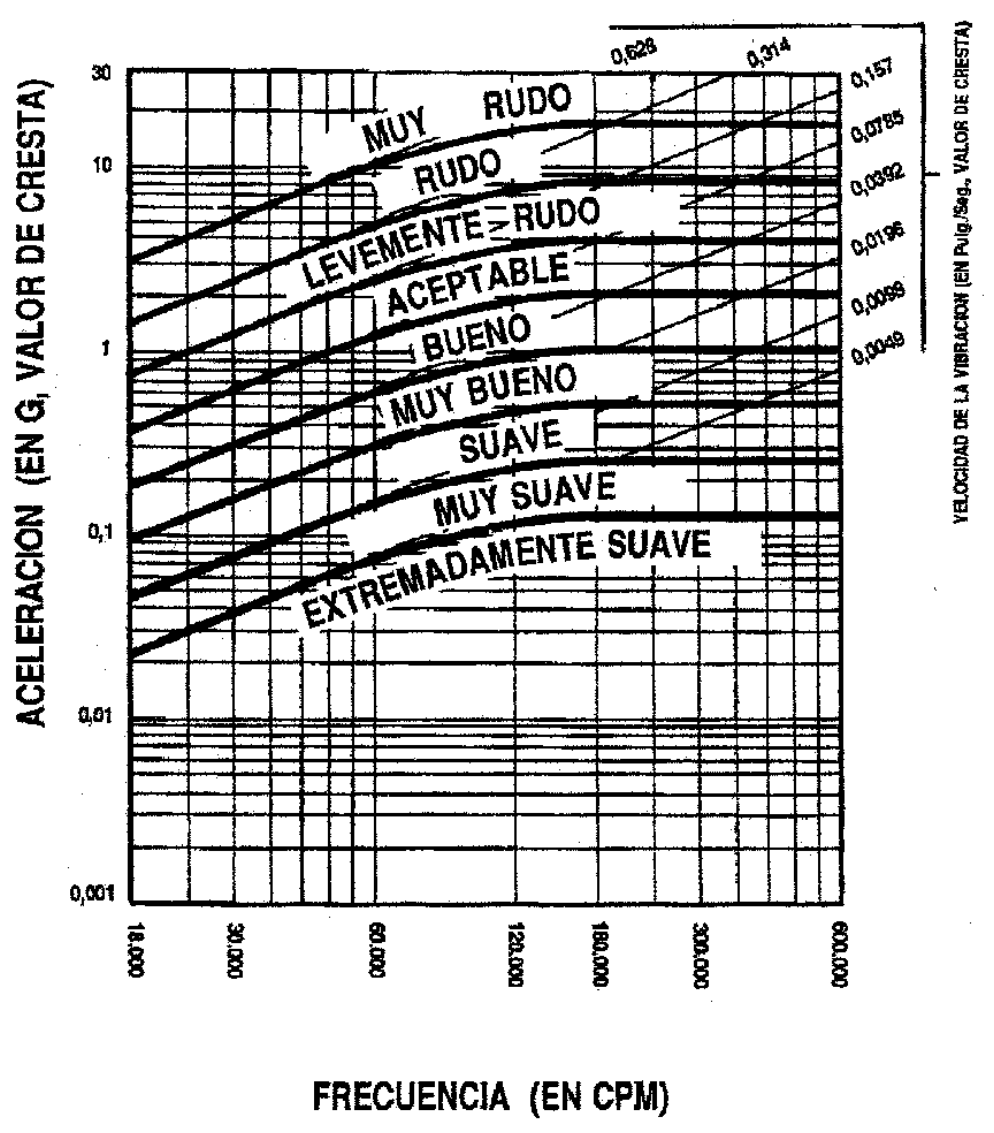
| Spike energy | Short-duration, high-frequency vibration energy pulses; it is basically a measure of acceleration | g-SE |
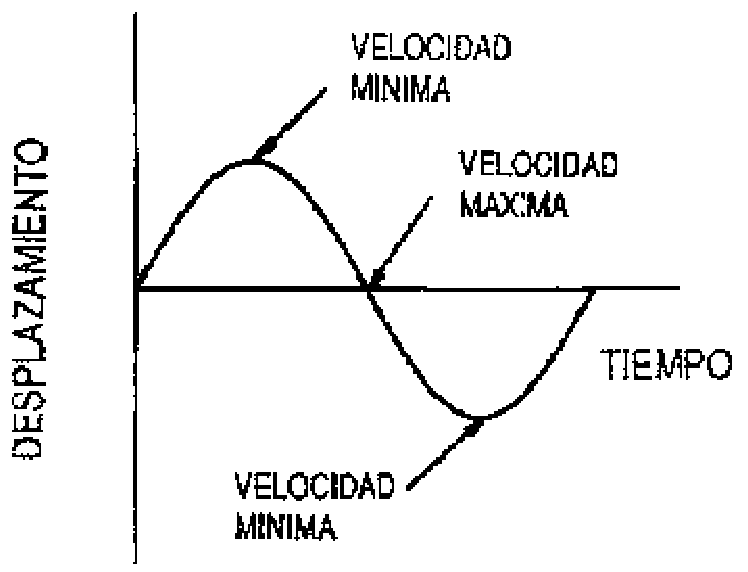
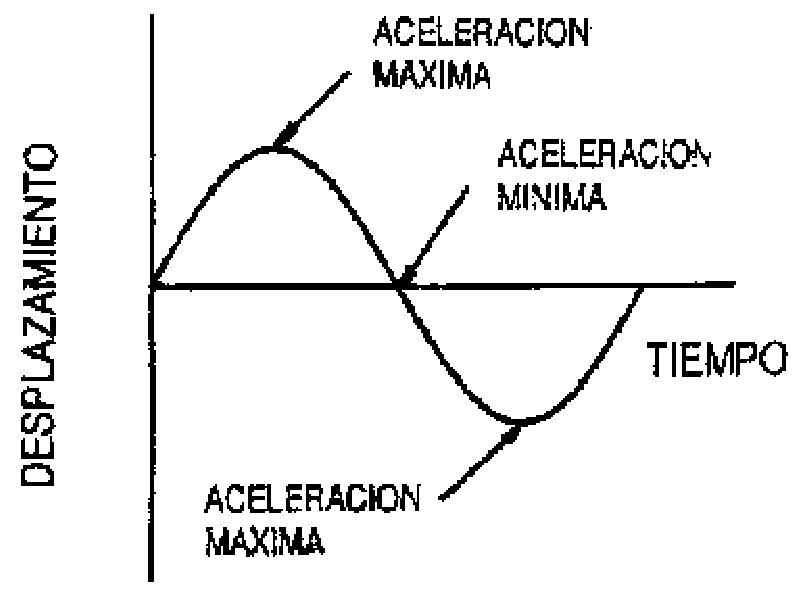
What magnitude to measure according to frequency
| Frequency interval | Measured magnitude |
|---|---|
| Below 600 cpm | Displacement |
| From 600 to 60,000 cpm | Speed |
| Above 60,000 cpm | Acceleration |
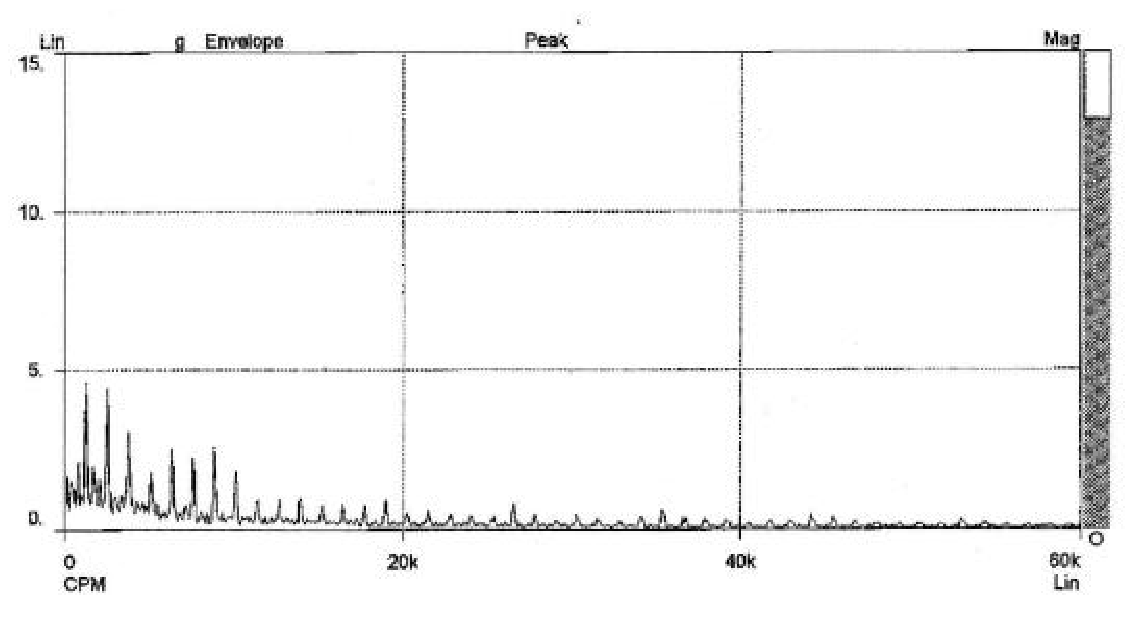
Spike energy detects pulses caused by surface defects in bearings or gears, friction, impact and metal-to-metal contact, high-pressure steam or air leaks, and cavitation due to fluid turbulence. Without this parameter, detecting defective gears or bearings is very difficult.
Vibration severity
Severity indicates the potential severity of a defect. The amplitude expresses the severity of the problem, but it is difficult to establish threshold values that detect a failure. With historical data, the average value reflects normal operation, and continuous or excessive deviations indicate a possible failure. Without historical data, severity charts are used.
Data acquisition
The analysis consists of two stages: data acquisition and interpretation. The data to be collected (displacement, velocity, or acceleration) depends on the machine's speed, according to its equivalent frequency ratio (rpm = cpm).
- Determine the design and operating characteristics of the machine: rotation speed, bearing and gear type, support, couplings, noise, speed and loads.
- Determine the purpose of the measure: routine, creation of a history and baseline value, or data collection before and after a repair.
- Select the parameters: displacement, speed, acceleration, or spike energy; these determine the transducer.
- Determine the position and direction of the measurements, generally on bearings or at points where failure is most likely.
- Select the measuring instrument and transducers.
- Determine the type of data required: total magnitude value, amplitude-frequency spectrum, amplitude-time, or spike energy.
- Take the data.
The three main measurement directions are horizontal, vertical, and axial. Radial directions (horizontal and vertical) are taken with the transducer axis at 90° to the axis of rotation.
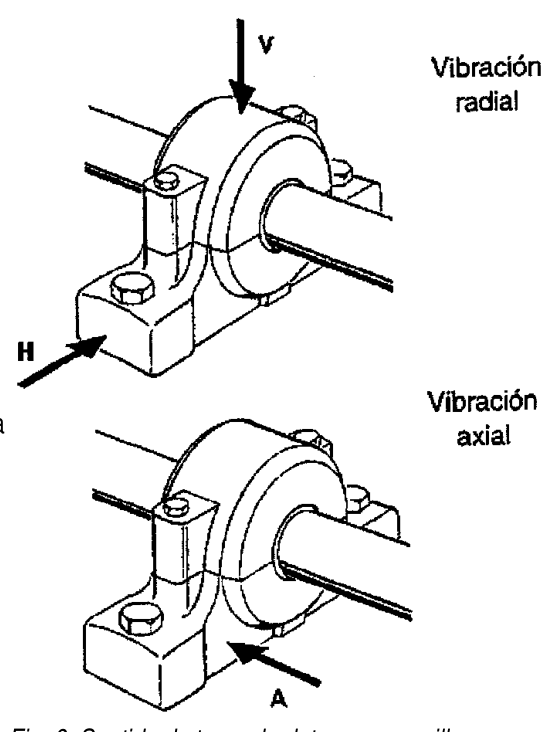
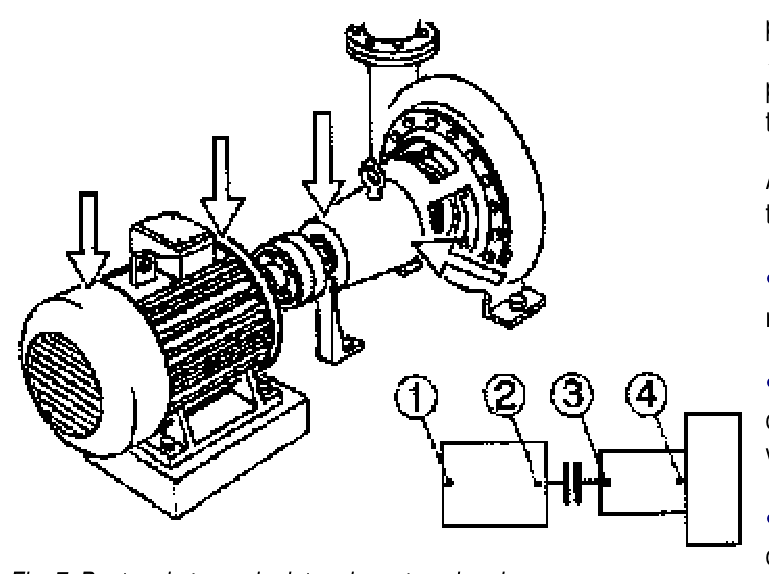
Data collection conditions
- Measurement sequences: take accurate data as quickly as possible.
- Data collection location always the same, with the transducer firmly attached.
- Monitoring the machine together with the operators and maintenance personnel.
- Control of the machine's external environment: appearance, noise.
- Pay attention to unexpected trends, and take further action if there are signs of trouble.
- Maintain only consistent data, taken accurately.
- Compare with similar machines and the same way of working.
Identification of causes by spectrum
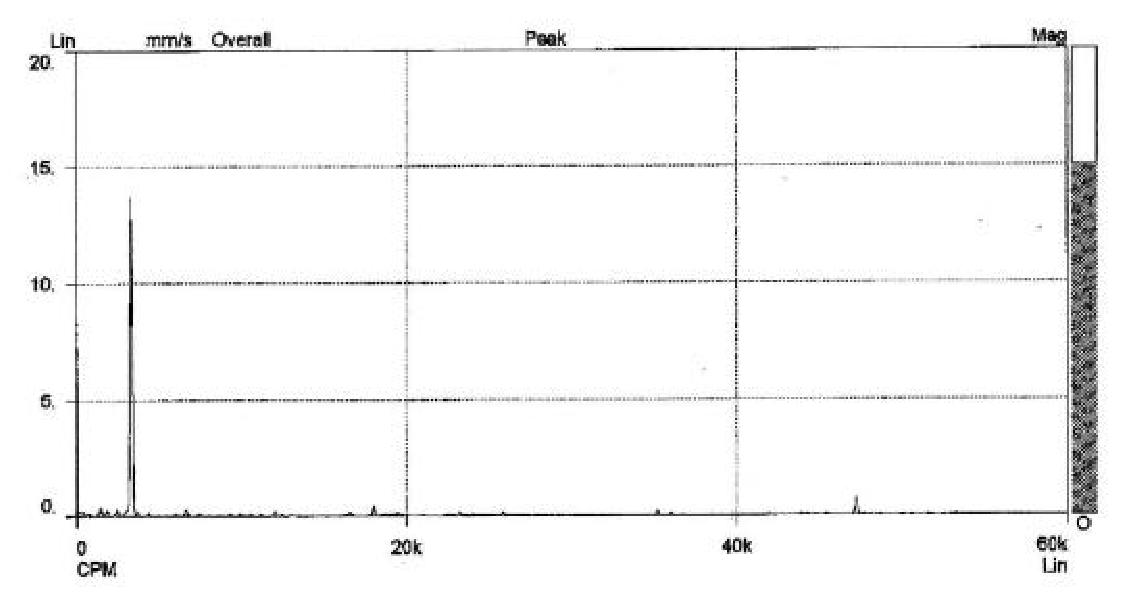
A properly functioning machine has values that follow a constant or slightly upward trend line. An unexpected increase indicates a potential problem. Typically, velocity amplitudes are compared, and if they increase, so are impulse energy (g) values, which indicate gravity. The maximum amplitude usually occurs where the problem is located, although the vibration can be transmitted to other points.
| Cause | Signal in the spectrum |
|---|---|
| Imbalance | Peak at a frequency that coincides with the rotational speed (1 x rpm); the amplitude is proportional to the amount of imbalance and is usually greater in the radial direction in machines with horizontal shafts |
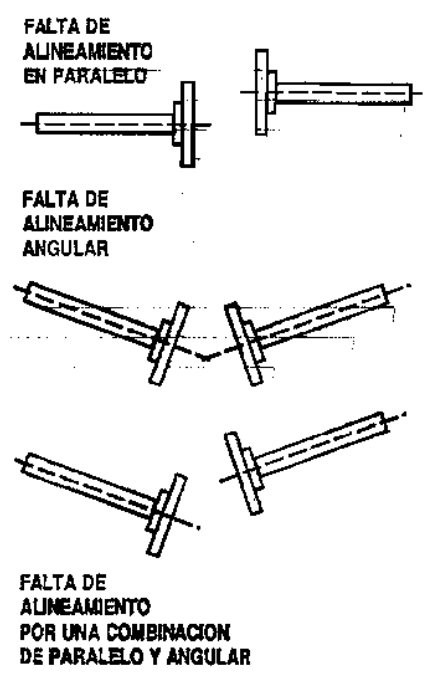
| Misalignment | Peaks at 1, 2, or 3 times the rotational speed in severe cases; similar pattern in all three directions; with high axial vibration (axial greater than half the radial) there may be misalignment or bent shafts |
| Parallel misalignment | Vibration primarily in the radial direction, with a frequency equal to twice the rotational speed of the shaft |
| Angular misalignment | Vibration in the axial direction on both axes, at a frequency of 1 x rpm |
| Gears | Peaks at whole multiples of the rotational speed of the failing gear, with very small lateral peaks separated by a distance equal to the rotational speed; there is noise |
| Electrical problems | Spectrum similar to that of imbalance, but the problem disappears when the current is disconnected; peaks at distances of four times the rotation speed if there are four poles |
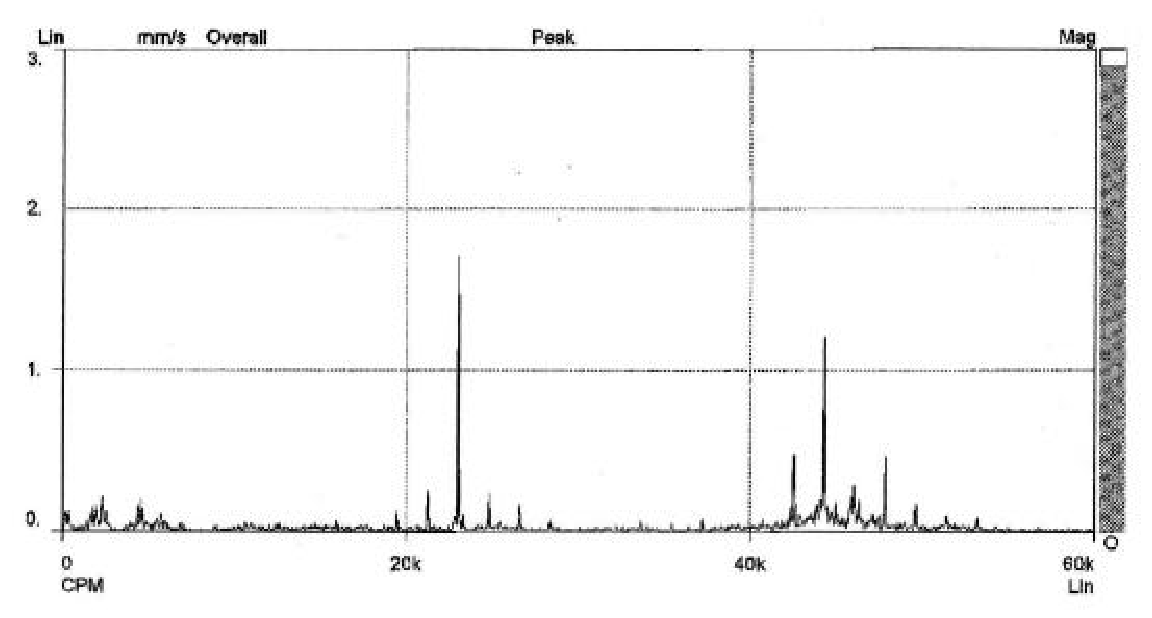
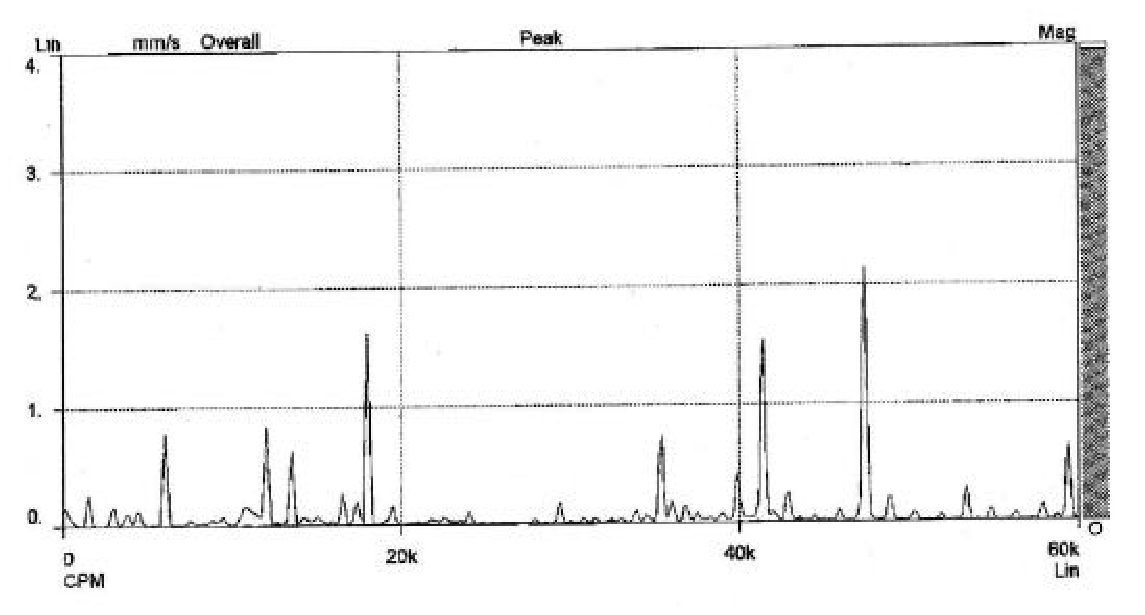
| Bearings | High frequencies unrelated to rotation speed and random amplitude; many peaks close together at high frequencies; excessive noise |
A spike at 1 x rpm doesn't only indicate imbalance: it can also be caused by misalignment, eccentric gears or pulleys, a bent shaft with high axial vibration, worn belts (if it coincides with the rpm), resonance, or electrical problems. In these cases, vibrations will also be present at other frequencies.
Bearings and machine condition
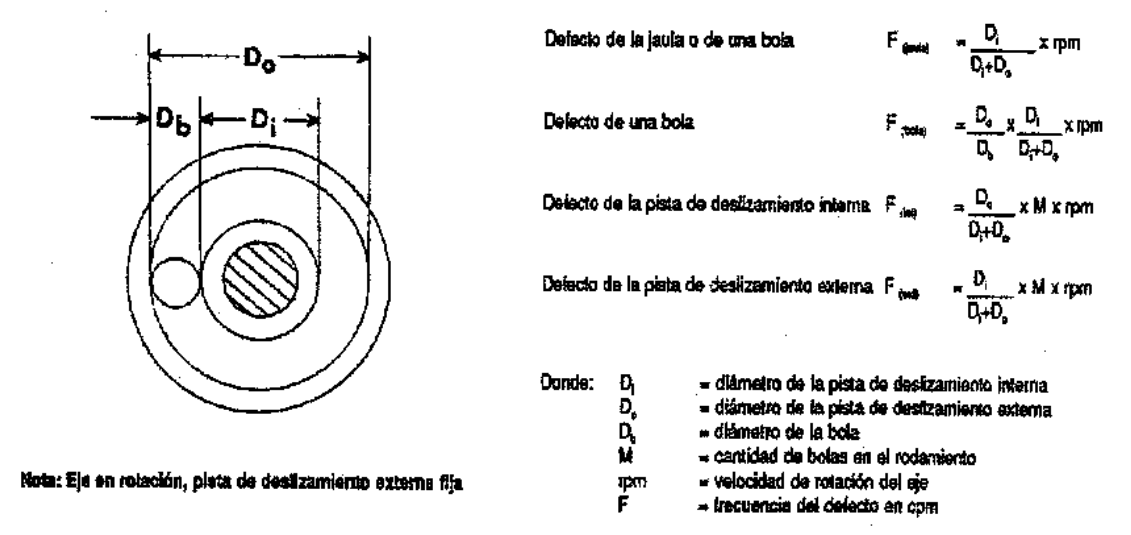
Defects in rolling elements, raceways, or cages generate forces that are transmitted to the housing. The frequency at which the amplitude is greatest is compared with those calculated using the formulas in Figure 18 to identify the defective component. With a defective bearing, it is important to know the spike energy, which allows one to anticipate the severity of the problem. A bearing failure is only detected in the measurement taken on that bearing, not in the rest of the machine.
| Machine status | Displacement | Speed | Acceleration | Spike energy |
|---|---|---|---|---|
| Good condition | Normal | Normal | Normal | Normal |
| Defective bearing: operation | Normal | Normal | Normal | High |
| Defective bearing: operation | Normal | Normal | High | High |
| Problems: analyze, stop | Normal | High | High | High |
| Problems: analyze, stop | High | High | High | High |
Bearings can fail due to assembly errors, inadequate lubrication, internal manufacturing defects, electrical current, misalignment, or because they are not prepared for the load they support.
Frequently Asked Questions
What quantity is measured according to the frequency of vibration?
Displacement below 600 cpm, speed between 600 and 60,000 cpm, and acceleration above 60,000 cpm.
How often are machine vibrations measured?
The interval depends on the equipment and varies from two months to continuous measurement, depending on the type of machine and its importance in the process.
What is spike energy?
It is a parameter that measures short-duration, high-frequency vibration energy impulses. It is essentially a measure of acceleration, and its unit is g-SE.
How is an imbalance in the spectrum recognized?
By a peak at a frequency that coincides with the rotational speed (1 x rpm), with amplitude proportional to the amount of imbalance.
How do you distinguish an electrical problem from an imbalance?
The spectrum of an electrical problem can be similar to that of an imbalance, but the problem disappears when the power is disconnected.
Related
- Types of vibration in machines: causes (PDF)
- Monitran MTN/1135C and MTN/1830 accelerometers
- Accelerometers and Vibration Sensors
- Monitran
- All technical information about GUEMISA
Below, the original PDF document is available for viewing or downloading.