Vibration analysis, thermography, lubricant analysis, among others, are predictive maintenance techniques that allow the causes of possible failures to be found in anticipation of the breakdown. For the implementation of predictive maintenance, it is essential to have a program and an organization that ensures constant and rigorous monitoring of the elements that make up the company.
Predictive maintenance program
The steps on which the predictive maintenance program is based can be explained as follows. The predictive maintenance program follows a logical sequence from the moment a problem is detected, it is studied, its cause is found, and finally the possibility of correcting it at the right time with maximum efficiency is decided. There are three steps involved:
- Detection: Recognition of the problem.
- Analysis: Locating the cause of the problem.
- Correction: Finding the time and way to solve the problem.
As stated, detection consists of finding a problem in the machinery. This requires constant and rigorous monitoring of the vibration level of a machine. The interval between measurements depends on each piece of equipment and can vary from two months to continuous measurement, depending on the type and importance in the process. The points chosen to take vibrations are those where it may be possible to find a defect that affects the proper functioning of the machinery. These will be places where bearings, fans, gears or joints between shafts are housed. At the points to be measured, speed, acceleration or displacement values will be taken, depending on the location of the point and the characteristics of the machine.
machine.
The device used will be a data collector together with a computer program that stores the values collected during routine inspections of the factory elements. From a historical record of data from the points of each machine, it is possible to detect a problem when the value trend increases or changes significantly.
The next step is to analyse the problem detected. Once this has been found, its possible causes are identified. This study is complicated, as it depends in each case on the point where the defect appears, the position and the environment of the machine. There are no features that unequivocally characterise a cause of excessive vibration, but experience, common sense and knowledge of each machine are essential points.
Finally, the next step is to correct the fault that has been detected and analysed. Once a problem has been found and its causes analysed, it is necessary to study the actions to be taken to solve it, while also finding the right time to repair it, trying to make it as efficient as possible and to have a minimal impact on the production process, taking advantage of a stoppage or a situation in which the workload for the machine is lower than in others.
Organization of the predictive maintenance program
A strict and constant monitoring of machine vibrations provides an early warning of a failure that may force a sudden stoppage, with all the consequences this may have from a production point of view. At the same time, this type of maintenance can reduce costs in the replacement of scheduled elements that can continue working for longer. It is therefore a way of improving the efficiency of preventive maintenance. The following nine steps are important in the organization of predictive maintenance:
- Plant recognition
First of all, before implementing predictive maintenance, it is necessary to decide its need and effectiveness in a company. This decision will depend on the type of machines, the quantity and their importance in the process. - Selection of machines
In a factory, a vibration study will be carried out according to an established schedule on those pieces of equipment that are an essential part of the production process, that is, those whose failure would cause significant losses from the production point of view, due to economic losses, difficulty and amount of time in restarting. Likewise, the part of the machinery that is important for the company due to its size or economic or productive value will be constantly monitored. - Choosing optimal techniques to verify
Way of carrying out verification, deciding what, how, when, where measurements are to be made. - Implementation of the predictive
The predictive implementation program must contain:- Machines to study.
- Measurement system, data collection and analysis.
- Data for comparison.
- Knowledge of the type of maintenance and the means to collect data.
- Setting and reviewing data and acceptable condition limits
To set a limit according to values that can be called normal, it is essential to have a history of data obtained in
repeated measurements. An average value of the data obtained will give the acceptable vibration level for each of the points
measured. The limits that mark an acceptable value will be set based on this historical data and experience.
At first, when you do not have a set of values that allow you to estimate whether a vibration is within the limits that
mark their normality, the acceptance of a value will be done through the manufacturer's instructions and with the graphs of
severity. - Reference measurements
There will always be a reference measurement with which each one taken will be compared to see if it is within the limits.
of acceptability. - Collection, recording and analysis of trends.
Here we will try to detect a possible defect in the machine. - Machine condition analysis
This step will confirm whether there really is a fault and determine its causes and the possible evolution it may undergo. - Bug fixes.
Vibrations
Definition and characteristics
To begin with, a definition and characteristics of vibration can be given. Vibration is the back and forth movement of a machine or machine element in any direction in space from its equilibrium position. Generally, the cause of vibration lies in mechanical problems such as: imbalance of rotating elements; misalignment in couplings; worn or damaged gears; deteriorated bearings; aerodynamic or hydraulic forces, and electrical problems.
These causes, as you might expect, are forces that change direction or intensity. These forces are due to the rotary movement of the machine parts, although each of the problems is detected by studying the vibration characteristics. The most important characteristics are: frequency, displacement, speed, acceleration, spike energy (impulse energy).
Frequency is a simple and significant characteristic in this analysis. It is defined as the number of complete cycles in a period of time. The characteristic unit is cpm (cycles per minute). There is an important relationship between frequency and angular velocity of rotating elements. The correspondence between cpm and rpm (cycles per minute - revolutions per minute) will identify the problem and the part responsible for the vibration. This relationship is due to the fact that forces change direction and amplitude according to the speed of rotation. Different problems are detected by frequencies equal to the speed of rotation or multiples of it. Each type of problem shows a different vibration frequency.
The amplitude of the vibration indicates the importance and severity of the problem. This characteristic gives an idea of the condition of the machine. The amplitude of displacement, velocity or acceleration can be measured. The vibration velocity takes into account the displacement and the frequency, and is therefore a direct indicator of the severity of the vibration. The severity of the vibration is indicated in a more precise way by measuring the velocity, acceleration or displacement according to the frequency range in which it occurs. Thus, for low frequencies, below 600 cpm, displacement measurements are taken. In the range between 600 and 60,000 cpm, velocity is measured, and for high frequencies, greater than 60,000 cpm, accelerations are taken.
Speed is another important characteristic in vibration, graphically it can be seen in figure 1.
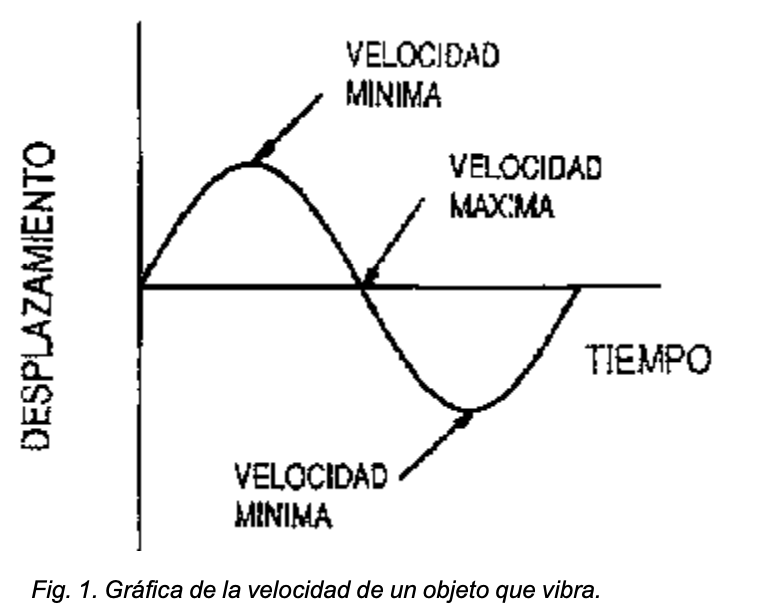
The highest peak speed of the entire travel of the element when vibrating is measured. The unit is mm/s. The change in this characteristic brings with it a change in acceleration. The speed has a direct relationship with the severity of vibration, for this reason it is the parameter that is always measured. Vibrations that occur between 600 and 60,000 cpm are analyzed taking into account the value of the speed.
Acceleration is related to the force that causes vibration, some of which occur at high frequencies, although speed and displacement are small. In Figure 2, you can see the vibration acceleration.

Spike energy provides important information when analysing vibrations. This parameter measures short-duration and therefore high-frequency vibration energy pulses.
They may be impulses due to: Defects on the surface of bearing or gear elements. Friction, impact, metal-to-metal contact in rotating machines. High-pressure steam or air leaks. Cavitation due to turbulence in fluids.
Without this parameter, it is very difficult to detect defective gears or bearings. This measurement quickly detects high-frequency vibrations caused by these defects. The spike energy value is basically a measure of acceleration, but has g-SE as its unit.
Vibration severity
An important point when talking about vibrations is to know the severity of the vibration, which indicates the seriousness of a defect. The amplitude of the vibration expresses the seriousness of the problem, but it is difficult to establish vibration limit values that detect a fault.
The purpose of vibration analysis is to find a warning with enough time to be able to analyze the causes and how to solve the problem, causing the minimum possible stoppage in the machine.
Once a historical data has been obtained for each element of the machines being studied, the average value reflects the normality of its operation. Continuous or excessive deviations will indicate a possible fault that will be identified later, taking into account the frequency at which the greatest vibrations occur.
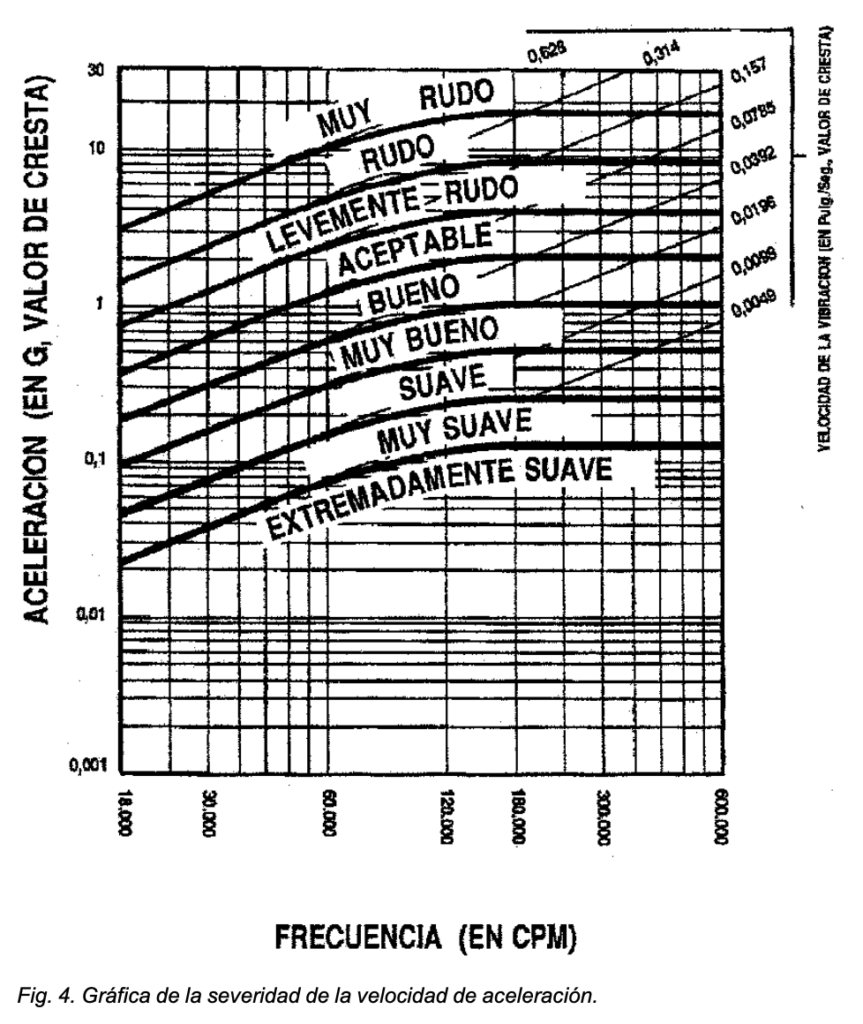
When there is no historical data for a machine, the vibration severity can be analyzed by considering the following graphs (figs. 3 and 4):

Analysis
The essence of vibration analysis is to perform vibration analysis. Data analysis consists of two stages: acquisition and interpretation of the data obtained by measuring the vibration of the machine. The goal is to determine the mechanical conditions of the equipment and detect possible specific mechanical or functional failures.
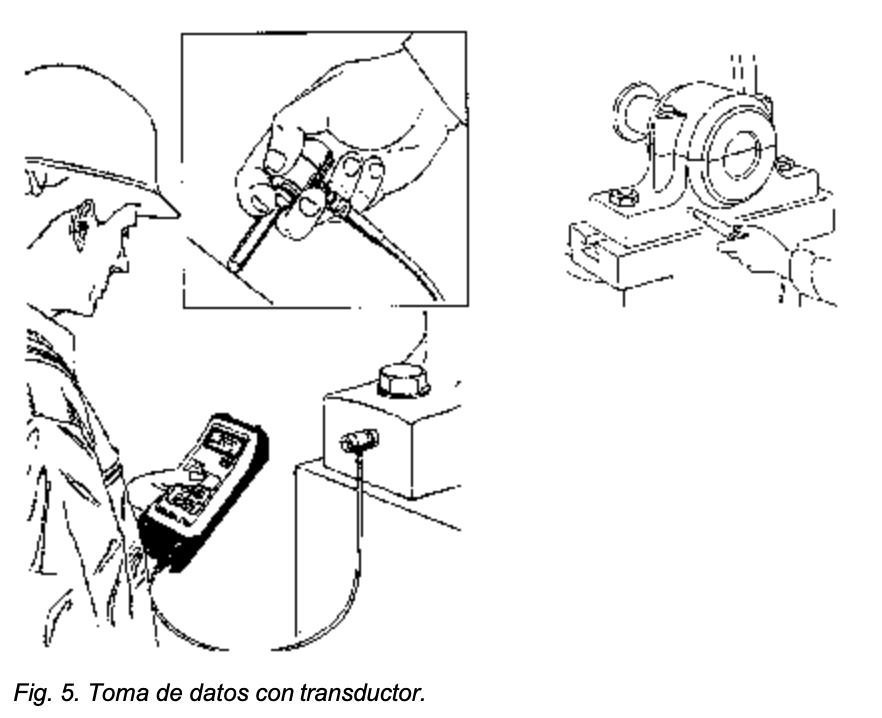
Data acquisition is the first and most important step to take in performing a vibration analysis. The data to be taken, displacement, velocity or acceleration, will depend on the speed of the machine, according to its equivalent frequency ratio (rpm=cpm). Thus, for low rpm (low cpm), displacement data will be taken. For speeds within the range of 600 and 60,000 rpm, velocities will be measured. And for those of a higher order, the data to be taken will be accelerations (fig. 5).
Steps to follow in data acquisition:
- Determination of the design and operating characteristics of the machine, such as: rotation speed of the machine, type of bearing, gear and environmental conditions in which it is located such as the type of support, couplings, noise, etc. Operating conditions such as speed and loads, among others, which will normally affect vibration measurements, must also be taken into account.
- Determination of the purpose of the vibration which may include:
Routine measures to detect a possible failure at a given time and determine the causes of it. Measures to create a data history and with it obtain a base value, on which the vibration value that the machine should have when its working conditions are normal will be based. Data collection before and after a repair, the measurement before will reveal the problem, defective element and will thus be more effective in repairing it. After the repair, measures will be taken to indicate the evolution of the replaced element or the correction of the existing defect. - Selection of measurement parameters: displacement, velocity, acceleration, spike energy. They will determine the transducer to be used.
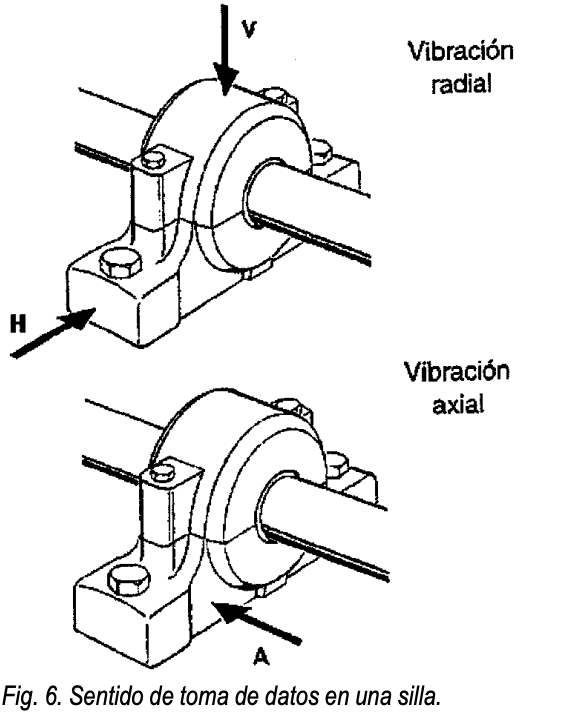
- Determination of position and direction of measurements with transducers, vibration will generally be taken at machine bearings or points where failure is most likely due to coupling, balance, points where vibratory forces are transmitted. The three main directions in a measurement are horizontal, vertical and axial. Radial directions are horizontal and vertical, and are taken with the transducer axis at 90º with respect to the axis of rotation, as shown in figure 6.
- Selection of measuring instrument and transducers.
- Determining the specific type of data required for the interpretation of the measurements made. This will save time when making the measurements and will provide more useful information for the analysis. The data obtained may include: total magnitude values, amplitude-frequency spectrum indicating the type of problem, amplitude-time for fast transient vibrations or very slow vibrations, spike energy in bearings, gears and cavitation problems (Fig. 7).
- Data collection. This is an essential step in the analysis, requiring attention and reliability of the measurements taken. When acquiring data, it is important to take into account:
- Measurement sequences, taking correct data as quickly as possible, avoid wasted time.
- The data collection location will always be the same, with the transducer firmly attached, for data accuracy.
- Monitoring the machine, that is, maintaining contact with the operators who work with it and those in maintenance, they will be the people who know the machine closely.
- Check the external environment of the machine, appearance, noise, etc.
- Pay attention to unexpected trends. Be prepared to take further action when there may be signs of a trend.
problem. - Keep only consistent, accurately captured data.
- Compare with similar machines and the same way of working.
Therefore, it can be said that data collection is an essential step for a good vibration analysis. For a good interpretation of the data, it is necessary to have reliable data that have been collected in a methodical and precise manner. This will allow a diagnosis of a problem to be made as accurately as possible.
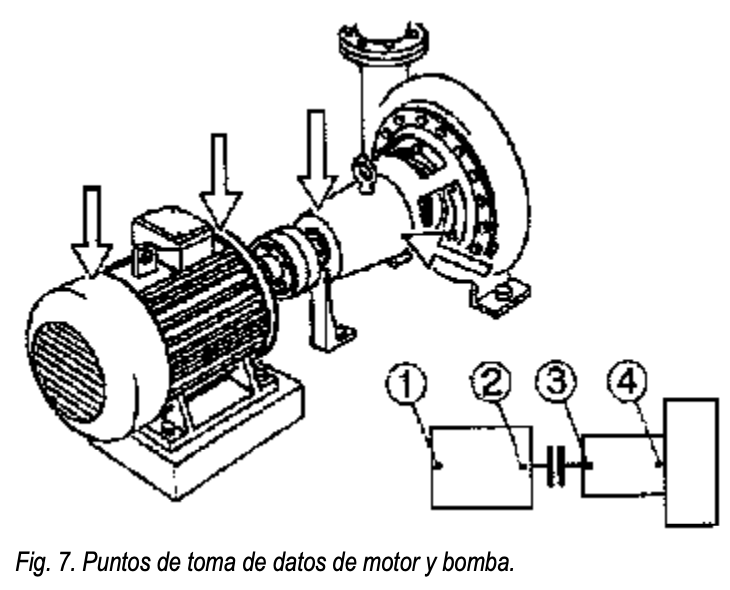
Identifying causes of vibrations. Data interpretation
Once the vibration data of a machine where a problem has been detected has been obtained in a methodical and precise manner, it is necessary to identify the cause and thus find the most efficient way and time to repair it, that is, one that eliminates the fault and its economic cost is as low as possible.
A defect can be located by comparing the amplitudes of the vibrations taken. Normally, a machine that is working correctly has values that tend to follow a line with a slightly ascending or constant trend. When at some point the values increase or the trend rises in an unexpected way, one can think of the presence of a problem.
Generally, the amplitude values that are compared are those of speed. Once it is observed that the speed has increased in an unexpected way, it is important to compare the values of the impulse energy (g). These values will indicate the severity of the problem. Thus, a fault can be detected by finding an unexpected upward speed trend and high values of the g parameter. It is also possible that when there is a problem, there are high spike energy values and suddenly they decrease and gradually increase. This can lead to a total failure, where the machine stops working. High spike energy values can be indicators in most cases of bearing and coupling problems and in the rarest cases of hydraulic problems.
Generally, the maximum amplitude of vibration occurs at the points where the problem is located, although the vibration is often transmitted to other points of the machine even if the problem is not located there. Analysis of the graphs can indicate the type of defect present, but very rarely do single problems appear and therefore spectra where a defect is clearly reflected. Experience and knowledge of the machine are two fundamental factors when identifying the cause of a significant vibration.
It is essential to monitor the progress of the repair once the problem has been corrected. This way, you will know if the defect really existed, if it was located at the point with maximum vibration and, more importantly, monitor the progress after the repair and ensure that the problem has disappeared.
The study of vibration data and their spectra is the basis for finding the causes and the way to correct the defect they indicate. It is only important to pay special attention to vibrations that are accompanied by other effects such as noise, oil loss or any other fault, or amplitude values that are excessive compared to others in correct operation. In these cases, the shape of the spectra will be analyzed to identify the causes of the problems.
The most common mechanical problems in machines that produce vibrations are imbalance between shafts, misalignment of couplings, defects in bearings and gears, and electrical problems. Below you can see how to identify these problems by analyzing vibration data and spectra.
Imbalance
This is one of the most likely causes of vibration in machines. In almost all elements it is easy to find a peak in the amplitude versus frequency graph, which denotes a small imbalance. As can be seen in the following graph (fig. 8) there is a peak at a frequency that coincides with the rotation speed.
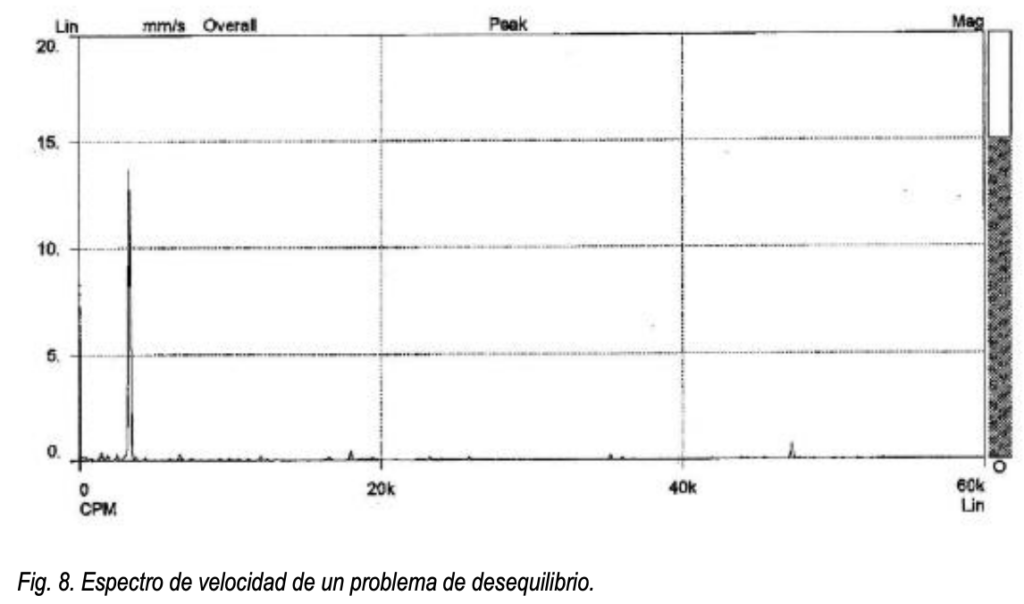
To know the amount of imbalance, you have to find the amplitude of the vibration at a frequency equal to 1 x rpm. The amplitude is proportional to the amount of imbalance. Normally, the amplitude of vibration is greater in the radial direction (horizontal and vertical) in machines with horizontal axes, although the shape of the graph is the same in all three directions. As stated before, to analyse vibration data, experience and knowledge of the machine are as important as the data taken from it. When a peak appears at a frequency equal to 1 x rpm. Imbalance is not the only possible cause, misalignment can also produce peaks at this frequency. When vibrations appear at this frequency, other possible causes are eccentric gears or pulleys, lack of alignment or a twisted shaft if there is high axial vibration, belts in poor condition (if it matches their rpm), resonance or electrical problems. In these cases, in addition to the peak at a frequency of 1 x rpm, there will be vibrations at other frequencies.
Misalignment
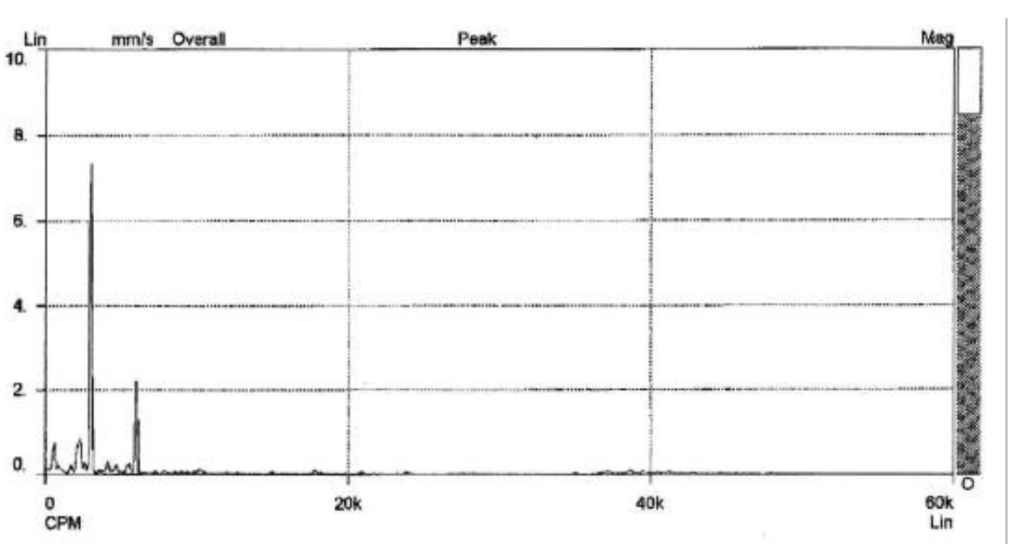
This is a very common problem due to the difficulty of aligning two shafts and their bearings in such a way that forces that produce vibrations do not arise. The vibration pattern of a twisted shaft is similar to that of a bad angular alignment. To recognize a vibration due to misalignment, the graph shows peaks at frequencies equal to the speed of rotation of the shaft, two or three times this speed in situations where this problem is serious. An example of the spectrum of this problem is seen in figure 9. The shape of the graph will be similar in the three directions, with only the amplitude varying. As in all cases, the amplitude is proportional to the severity of the defect, here misalignment. This fault can present high vibration in the axial direction as well as in the radial direction. Thus, whenever there is high vibration in the axial and radial direction, and if the axial is greater than half of the radial direction, there may be a problem of misalignment or twisted shafts. Figure 10 shows the three basic types of misalignment: parallel, angular and a combination of both. The lack of parallel alignment, figure 11, produces mainly vibration in the radial direction with a frequency equal to twice the rotational speed of the shaft.

Angular misalignment, shown in Figure 12, gives vibration in the axial direction on both shafts at a frequency equal to 1 x rpm.
Misalignment conditions do not always lead to coupling. A misalignment between the shaft and its bearing, figure 13, is a common example of this defect and can only be eliminated by correcting the placement of the bearing. A bushing that is misaligned with its shaft, as shown in figure 13, does not create significant vibration, unless there is also an imbalance problem, which would be the defect that would cause a misalignment.
Gears

This defect can be observed by finding peaks at frequencies that coincide with integer multiples of the rotational speed of the failing gear, and there will also be vibration of lower amplitude symmetrically to the gear frequency. Figure 14 shows peaks of significant value at frequencies that are multiples of the rotational speed of a pinion; symmetrically to these peaks there are other peaks of very small value and separated by a distance equal to the rotational speed.
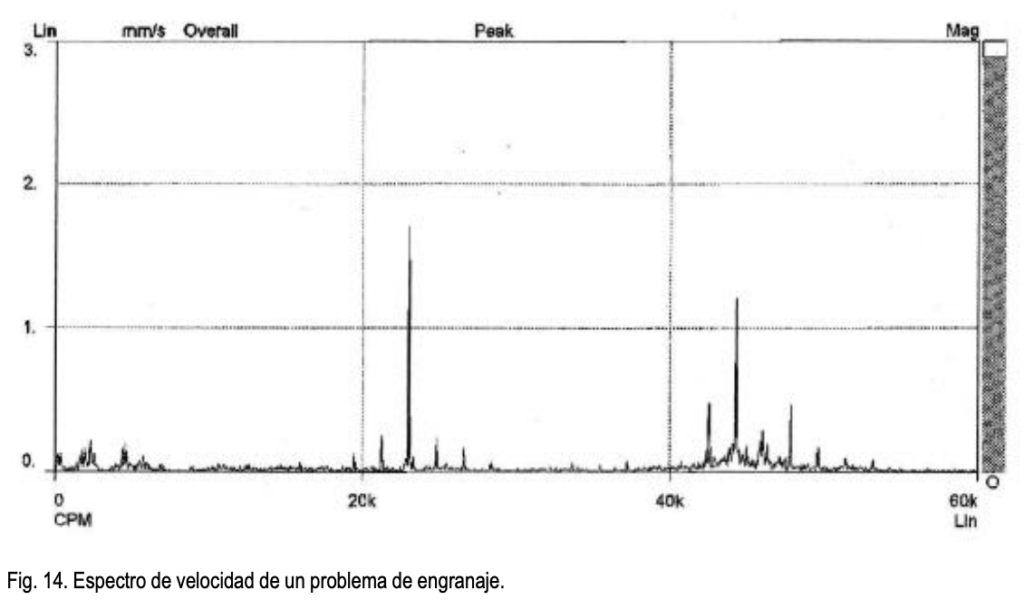
Gear problems that cause this vibration are: excessive tooth wear, tooth inaccuracy, lubrication failures, foreign elements between teeth. Vibrations caused by gear defects can be detected at various points in machines. This is a characteristic that differentiates a graph caused by a lightly loaded gear from vibration produced by a bearing, since the amplitude versus frequency diagram can lead to confusion when the pinion load is low.
Both gear and bearing failure also lead to noise.
Electrical problems
Vibration is created by unequal forces that can be caused by the internal shape of the element. It is difficult to recognize this problem graphically, since it does not have characteristics that easily indicate that this is the cause of vibration.
The spectrum can be misleading because it is similar to that of the imbalance, except that when the current is disconnected the problem will disappear. Higher peaks will be detected at distances equal to four times the rotation speed if there are four poles, distinguishing the separated vibration at a frequency coinciding with the rotation speed. Figure 15 shows the spectrum that gives this type of problem.

Bearings
Defects in bearing elements produce vibrations at high frequencies unrelated to the rotation speed and with a random amplitude. Figures 16 and 17 below show the velocity and acceleration spectra, respectively, of a defective ball bearing. It is relatively easy to recognise this fault by looking at the amplitude-frequency graph, as it is characterised by having many peaks together at high frequencies and with variable amplitudes that will depend on the severity of the problem. The frequency at which the maximum amplitude occurs can give an idea of the defective element of the bearing. Defects in rolling elements, bearing races or retaining cage generate forces that are transmitted to the housing and structure surrounding them.

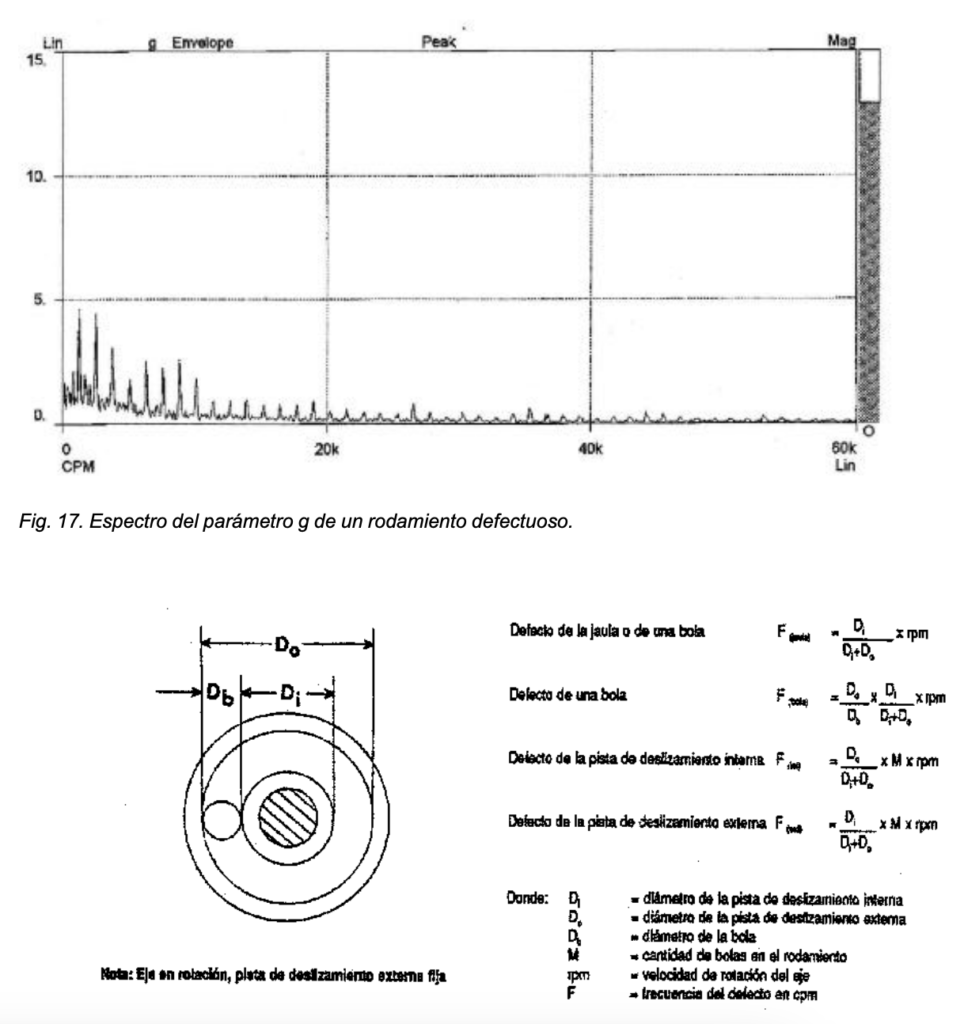
To detect what type of fault exists, the frequency at which the amplitude is greatest must be obtained and compared with those calculated according to the formulas given in Figure 18.
When this is the cause of the vibration, it is very important to know the spike energy value, as this parameter can help to predict the severity of the problem. The graph representing g-frequency indicates that the bearing vibration at high frequency is unstable and generated randomly.
Thus the status of the machine is identified according to the following table:

A bearing failure is only detected by the measurement performed on it, i.e. it will not be transmitted to the rest of the machine's points. Externally, a defective bearing will be noticeable by excessive noise.
Bearings are important elements in the machine and their failure can cause more serious problems, so it is necessary to take special care of them. They can fail due to assembly errors, inadequate lubrication, internal manufacturing defects, electrical current, misalignment, bearing not prepared for the load it supports. These are the most common causes of failure.
Therefore, vibration analysis is a technique that, although not exact, is capable of finding faults in machines, anticipating the breakdown. The advantages of carrying out this type of maintenance are the disappearance of sudden faults in the equipment studied, knowledge of the state of the machine at all times. This reduces the economic costs of unforeseen repairs, stoppages in the production process, changes of elements that can still continue to function, increased efficiency and reduced costs of a stoppage. In addition to all this, it helps to improve the preventive maintenance to be carried out in the factory. Behind all this, the advantages offered by this study are mainly of an economic nature,
safety against sudden breakdowns.


